Who Takes Control When 63% of Stocks Sit in RSI 40–60?
Nifty 500 RSI breadth shows a large middle group—the next trend depends on which way it moves.
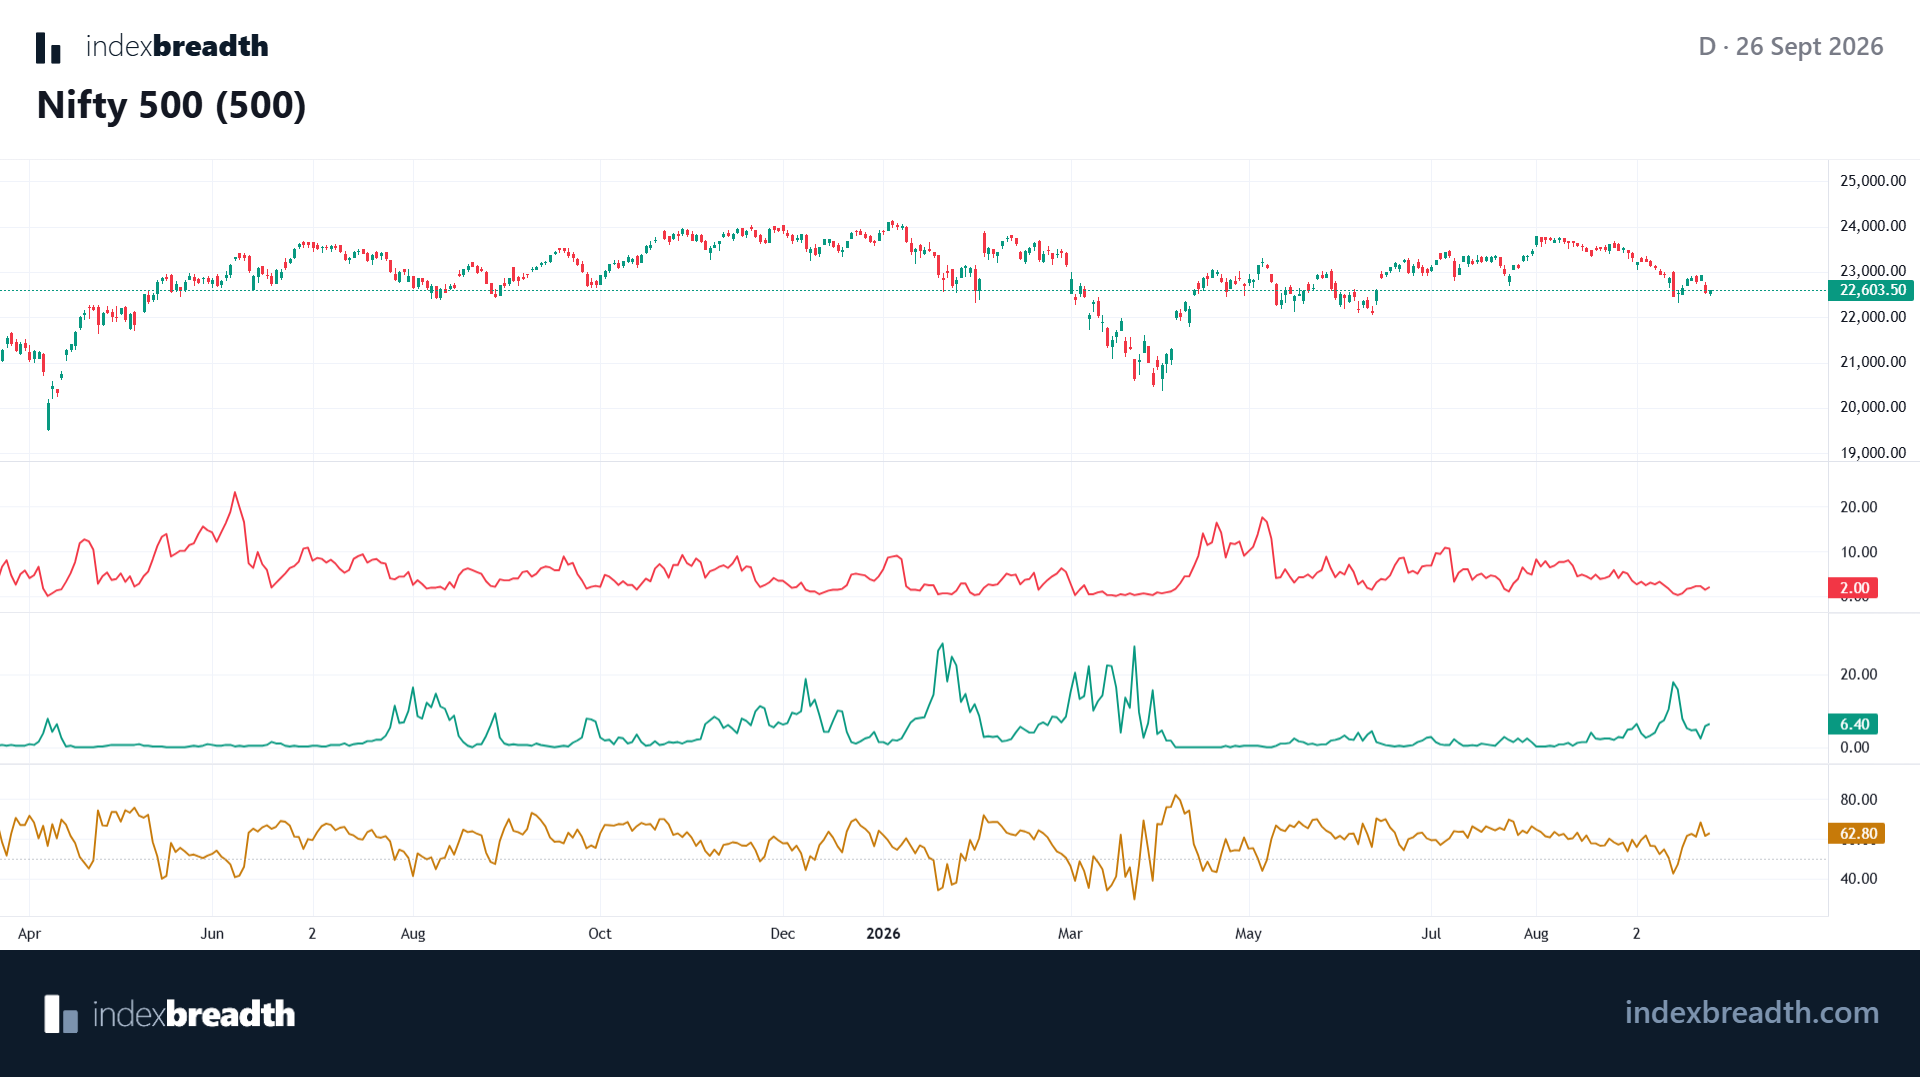
The market question I am asking today is simple: when most stocks sit in the RSI 40–60 range, who takes control of momentum next?
The supplied IndexBreadth chart is for Nifty 500 on 26 September 2026. It shows three breadth readings: 2.0% of stocks above RSI 70, 6.4% below RSI 30, and 62.8% in the RSI 40–60 range.
Read the distribution before making a call
| RSI breadth group | Reading on the chart | Approximate Nifty 500 stocks |
|---|---|---|
| Above RSI 70 | 2.0% | 10 |
| Below RSI 30 | 6.4% | 32 |
| RSI 40–60 | 62.8% | 314 |
The conversion is only a simple way to make the percentages tangible: 6.4% of a 500-stock universe is roughly 32 stocks. The series are separate breadth groups, so they should not be added together as though they are one complete partition of the index.
The middle group is where momentum can change hands
I would not call the 40–60 concentration a sideways-market signal by itself. This is a common part of any RSI distribution. Its real value is that it identifies the large pool of stocks that can decide the next broad move.
Here, around 314 constituents are in that middle range. If a meaningful portion starts moving above 60 and then into stronger momentum territory, buyers are taking control across the index. If the group instead drifts below 40, selling pressure is spreading through the same broad pool of stocks.
That is why I think this is a useful market-breadth reading. It moves the discussion beyond whether the Nifty 500 price is up or down today and asks whether participation is gathering behind the next trend.
What the extremes add to the picture
Only about 10 stocks are above RSI 70. That does not make the market automatically bearish, and it does not make every one of those stocks a sell. In breadth terms, it simply says broad upside momentum is limited at this point.
The lower extreme is larger: around 32 stocks are below RSI 30. The imbalance between the two tails is worth tracking. More stocks are presently at the weak end of the distribution than at the strong end.
But I would keep the focus on change rather than a single endpoint. The most useful question is whether the 40–60 group begins feeding the upside or the downside over the coming sessions.
What I am watching next
- A rise in stocks above RSI 70 together with a reduction in stocks below RSI 30 would show strengthening upside participation.
- An expanding below-30 reading while the above-70 group remains thin would show weakness spreading.
- A stable middle group is neutral only until it starts breaking meaningfully in one direction.
For this reading, the chart does not give us an automatic buy or sell instruction. It gives us a map of where market-wide momentum is sitting, and where control may shift next.
Where to see it on IndexBreadth
Use the Nifty 500 view in IndexBreadth to compare price with RSI breadth readings over time. The percentage above RSI 70, below RSI 30, and inside the middle band work best when followed as a changing distribution rather than isolated labels.
Sign up for IndexBreadth to follow participation across the NSE market.
Lovelesh Sharma
SEBI Registered RA
INH000027937
CMT, CFTe
The views expressed are for educational purposes only and do not constitute investment advice.
Tags: #MarketBreadth #StocksAboveMovingAverages #IndexBreadth #RSIBreadth #Nifty500 #RSIAbove70 #RSIBelow30